
BAERI’s Emma Yates is part of a small group of research scientists who look at…
Operation IceBridge: A Window Seat into Polar Observations
By Ian Watsky
Thirteen years, 15 aircraft, 968 flights, and nearly 5,000 flight hours: that’s the combined effort it took to monitor and collect data on Earth’s cryosphere, otherwise known as the frozen part of the planet. NASA’s Operation IceBridge (OIB), spanning from 2009 to 2021, was the largest polar airborne campaign ever undertaken. Started out of necessity after NASA’s Ice, Cloud, and land Elevation Satellite (ICESat) failed in 2009, IceBridge rose to the occasion and proved to be much more than a stopgap measure, producing an invaluable dataset that is still used by scientists today.
How does the cryosphere connect with the global climate system? There are various physical, chemical, and biological processes on Earth that connect us all, and perhaps no system has been more affected by these connections than our global climate. In the early 20th century, scientists first found evidence that Earth is warming due to human actions. In 1978, NASA began utilizing the Nimbus 7 meteorological satellite to monitor Earth’s ice sheets in an attempt to understand how our warming climate impacts the coldest parts of the world.
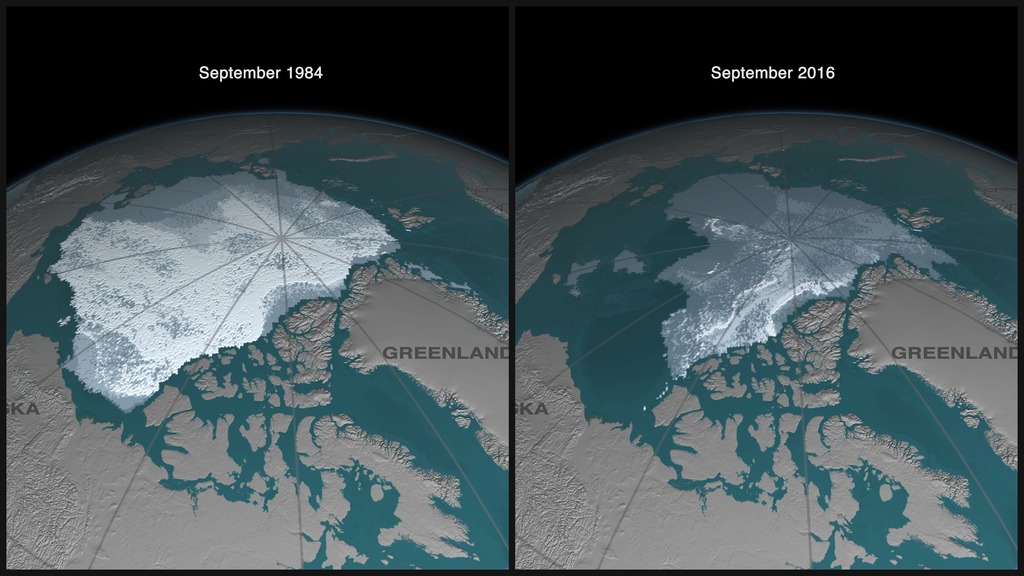
A comparison of Arctic ice in 1984 versus 2016. Image: NASA.
Data from Nimbus 7, along with additional satellite data collected by the European Space Agency (ESA) in the 90s, revealed that the cryosphere was thawing rapidly and NASA needed a more detailed view of the ice to determine the true extent of the damage. In 2003, NASA launched ICESat to measure ice sheet mass balance (the net balance of ice lost versus ice gained), one of the primary indicating factors used to determine the health of Earth’s ice sheets.
Early ICESat data indicated that the cryosphere was thawing rapidly, raising extreme concerns about the continued rise in global temperatures. The cryosphere is approximately 30 million square kilometers, or about three times the size of the continental United States. Scientists predict a domino effect on all of Earth’s systems if a significant fraction of this ice mass melts, resulting in increased temperatures, rising sea levels, and more-violent weather patterns.
ICESat’s data quickly proved invaluable to many climate change scientists fighting to ensure that we do not reach this tipping point. It used a lidar system known as the Geoscience Laser Altimeter System (GLAS) as its primary measurement tool — the first of its kind to observe the polar regions.
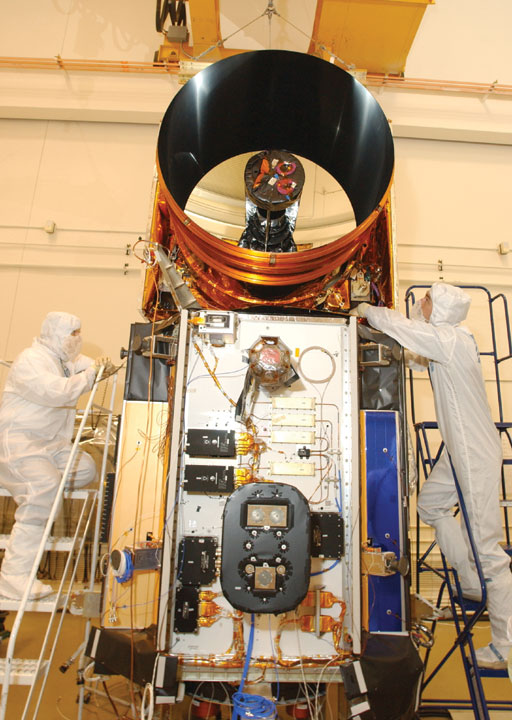
GLAS being attached to ICESat following initial mechanical integration on June 18th, 2002. Image: NASA.
A laser altimeter is a piece of equipment that emits a laser down from a satellite or aircraft. Once contact is made with the surface, the laser bounces back up to the source. The time this process takes is used to determine the height of the ground below and produces valuable data on the landscape’s details. ICESat’s laser altimeter utilized three separate lasers to measure the topography of ice sheets, each operating independently from one another.
Only 36 days into orbit, one of the three lasers that made up GLAS failed, despite the predicted three-year lifespan. For engineers on the ground, this was a near-worst-case scenario and posed an immediate threat to ICESat’s data-collection abilities. Luckily, GLAS’s independent three-laser system enabled operations to continue, although this put an additional strain on the remaining two lasers.
To remedy the strain, the ICESat team decided to move away from the planned continuous 24-7 observations and instead prioritize mission longevity. Intermittent observations were ICESat’s best chance for survival and ultimately allowed the mission to continue for seven years, far surpassing the initial three-year estimate. Nearing the conclusion of the seventh year of operation, it became increasingly clear that GLAS’s remaining two lasers were inching closer to their overdue end.
To prepare for the expiration of GLAS’s remaining lasers, NASA began a years-long process of developing and building the next iteration of ICESat, dubbed ICESat-2. In the interim, a mission would be needed to fill the gap in observations and continue to monitor the polar regions. NASA initially considered two potential satellite fixes, ICESat-lite and Quick Ice, each of which was designed to be a limited version of ICESat. After brief internal discussions, these “quick-fix” options were scrapped due to a lengthy implementation timeline and high cost of development.
NASA then pivoted to a new idea — one that would take more person-hours but could be quickly implemented using aircraft instead of spaceborne satellites. IceBridge became the most realistic solution and was officially approved in 2009, shortly before ICESat’s remaining two GLAS lasers officially expired in February 2010. After securing funding, aircraft, and a team, IceBridge took to the sky in search of answers.
While IceBridge was a mission born out of necessity, there were distinct benefits to airborne surveys compared to space observations. Most airplanes, such as NASA’s DC-8 and P-3, were much larger than the roughly refrigerator-sized body of ICESat and could therefore house more equipment. The increased capacity allowed the IceBridge team to outfit these aircraft with more niche instruments. In addition to laser altimeters, IceBridge flight instrumentation often included radar sounders, cameras, gravimeters, and magnetometers. The unique collection of instruments on board allowed IceBridge to observe the entire ice column with astounding clarity.
Like ICESat, IceBridge observed two distinct types of ice in the cryosphere — sea and land ice. Sea ice forms when salty sea water freezes over, often forming in jagged shapes due to the ocean’s turbulence. This layer of ice can be anywhere from a few centimeters to a few meters thick and covers approximately 15% of Earth’s oceans during the coldest parts of the year. Contrastingly, land ice can be thousands of meters thick, forming after snow accumulates and is compressed over centuries. Both sea and land ice have been receding at an increasing rate in recent years.
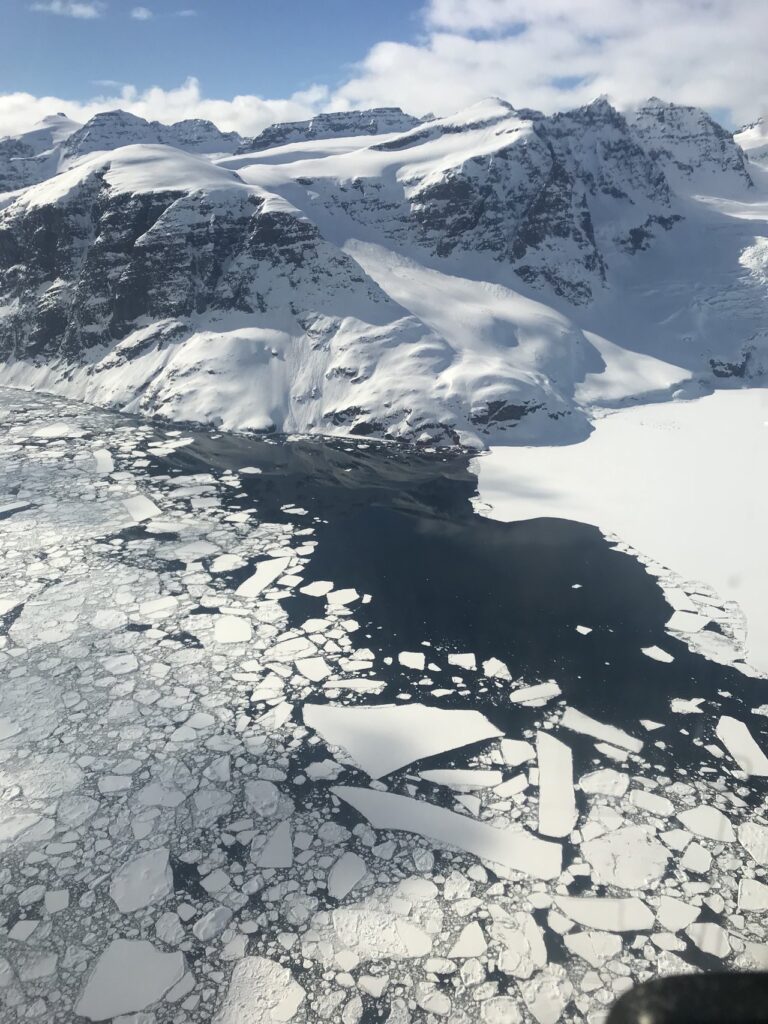
Above Greenland, where land ice meets sea ice and some open water. Credit: NASA/Linette Boisvert.
To analyze this recession, IceBridge launched springtime campaigns in the Arctic, Greenland, and Alaska (March–April) and in Antarctica (October–November). Springtime is the optimal time to conduct observations, since ice sheets are thickest after a long winter freeze. Because springtime varies for each hemisphere, the IceBridge team often traversed the grueling 12,000 miles from Antarctica to the Arctic. “It was a big undertaking. We were doing two big airborne campaigns, going back and forth every year.” says Joe MacGregor, former project scientist for IceBridge.
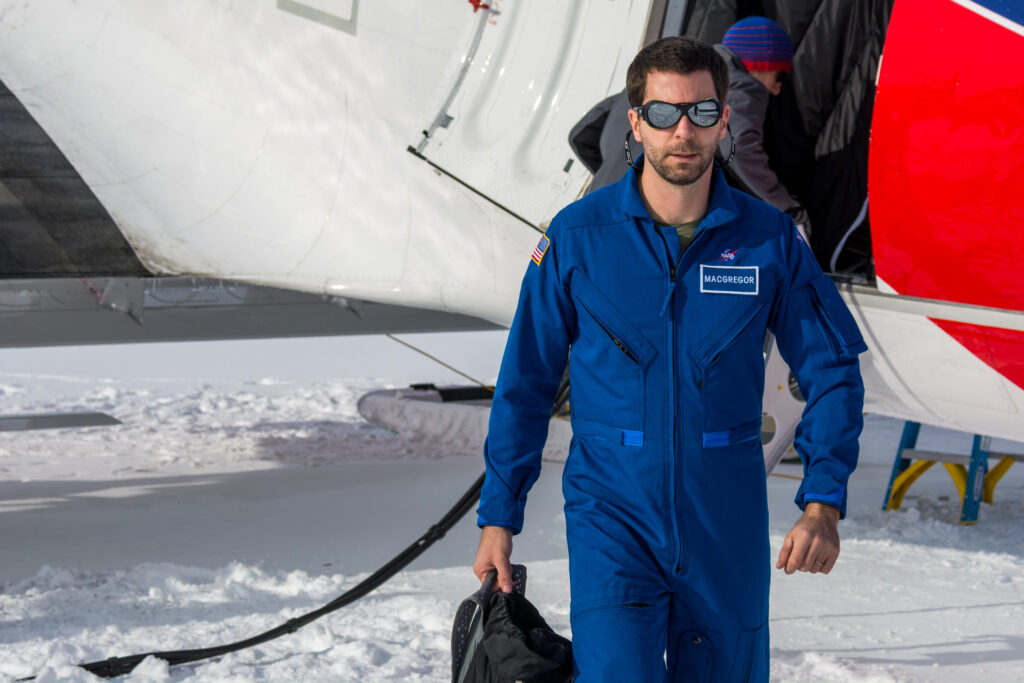
Joe MacGregor prepares to fly a mission over the Transantarctic Mountains on December 11, 2017. Image: Mike Lucibella, NSF.
A mission with as much travel as IceBridge required extensive logistical planning. This is where the Bay Area Environmental Research Institute (BAERI) stepped in. BAERI contractors and NASA civil servants who make up the Earth Science Project Office (ESPO) joined IceBridge to manage travel coordination. ESPO’s work granted scientists the freedom to focus solely on their research.
In addition to moving large aircraft and delicate scientific instruments, ESPO also coordinated travel for members of the IceBridge team. This included pilots, technicians who operated the various aircraft systems (safety, electronics, communications, etc.), instrument scientists, project scientists, and often members of the media. MacGregor recalls that “the [OIB] team evolved over the years. People came and went … , but many people stuck around for a long time because it was important.”

2017–2020 Operation IceBridge science team poses for a photo. Image: NASA.
The IceBridge team also varied for each individual campaign. Flights on larger aircraft such as the DC-8 could require more than 50 people, with 30–35 team members in the air at any given time. For campaigns on IceBridge’s AS350-B3 helicopter, the flight team may have been fewer than five. Missions across the Arctic and Greenland required long flights at low altitudes, making the P-3 (crew size of 24) a perfect choice of aircraft, while Antarctic missions often required the quick take-off abilities of a ski-equipped DC-3T (crew size of 12). Each of the team’s 15 aircraft had a unique purpose, and the team size adjusted accordingly.
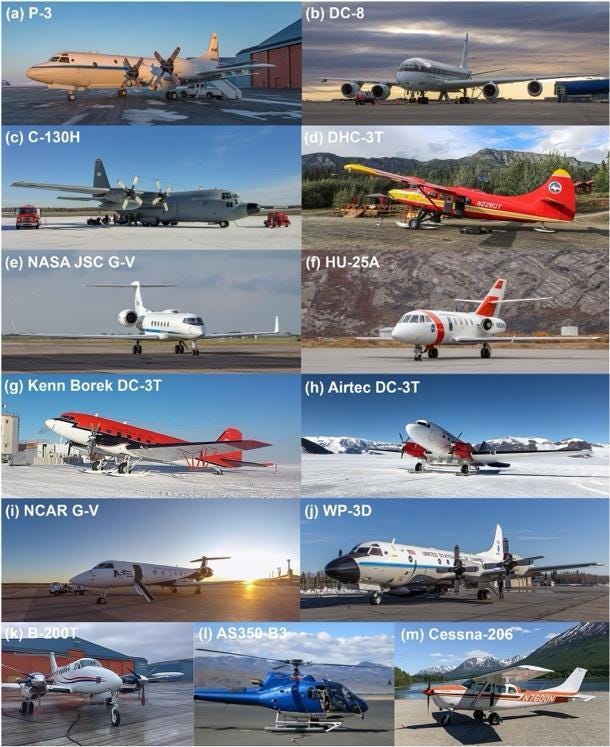
Photographs of most aircraft deployed by OIB between 2009 and 2021. Credit: Jeremy Harbeck, except (d) Jefferson Beck, (g) Duncan Young, (h) Joseph MacGregor, (i) Nathan Kurtz, (k) Helen Cornejo, (l) Sander Geophysics and (m) Jack Holt. “Reviews of Geophysics,” volume 59, issue 2, First published May 3, 2021, DOI: 10.1029/2020RG000712.
The variety of aircraft allowed the IceBridge team to travel to some of the most remote regions on Earth. In many cases, especially in the Arctic, it was safe to assume that the team members on board were the first humans ever to lay eyes on a particular sheet of ice. “It was mesmerizing to get a sense of the environments and to get a sense of the subtleties and the differences of various places across both ice sheets,” says MacGregor.
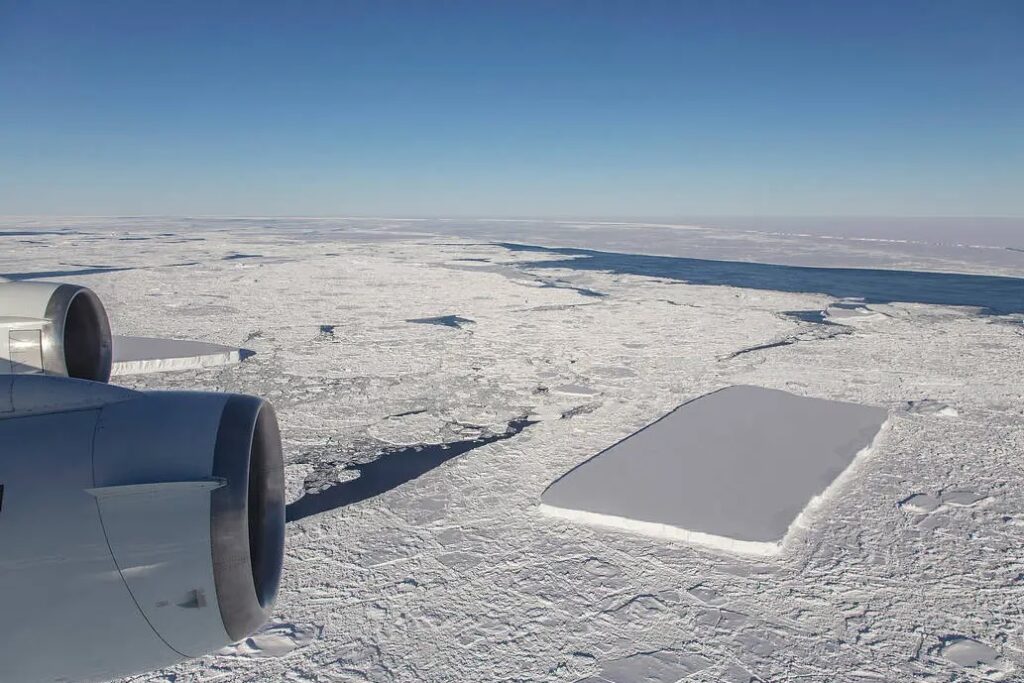
Two rectangular icebergs floating among sea ice just off the Larsen C ice shelf in Antarctica, October 16, 2018. Image: Jeremy Harbeck.
In late 2018, ICESat-2 launched from Vandenberg Air Force Base in California to continue the observations first started 15 years earlier by its predecessor ICESat. ICESat-2 represented a leap forward in laser altimeter technology by emitting six moving lasers at a time, greatly increasing the satellite’s observational capabilities. Tom Neumann, ICESat-2 project scientist and deputy director of the Earth Science Division at NASA Goddard, described the improvements: “If the two satellites were flown over a football field, ICESat would take only two measurements — one in each end zone — whereas ICESat-2 would collect 130 measurements between each end zone.”
During the first 14 months of ICESat-2’s observations, IceBridge aircraft flew directly under the satellite’s orbit to compare measurements and confirm that ICESat-2 was functioning properly. On November 20th, 2019, IceBridge completed the mission’s final polar flight in Antarctica. From 2019 to 2021, the IceBridge team continued to fly sporadic flights over Alaskan glaciers to record elevation changes and collect data on glacier flowlines. Flowlines can be characterized as a glacier’s response to climate change and often occur in winding mountain valleys, making observations from satellites like ICESat-2 nearly impossible.
The data produced from the IceBridge campaign are vast: they have directly contributed to over 660 scientific publications so far. IceBridge researchers and NASA personnel have collaborated to share data with scientists, organizations, and governments around the world to collectively protect the cryosphere. When describing this joint effort, MacGregor says, “[OIB measurements] were not compiled in a vacuum [but] with decades of efforts by a lot of countries, particularly in Antarctica, to make sense of the structure of the ice sheet.”
Many countries and agencies (particularly the ESA) also collect their own cryospheric data. The data from each country’s polar missions are unique, holding just a piece of the overall puzzle. As scientists begin to compare these international datasets with one another, the threat of climate change, which recognizes no borders, becomes increasingly clear.
What began as a mission to bridge the gap between ICESat and ICESat-2 quickly took on a life of its own. IceBridge resulted in numerous unexpected discoveries and its legacy continues to grow as scientists synthesize mission data and begin to answer important questions about our warming planet.
Related Posts