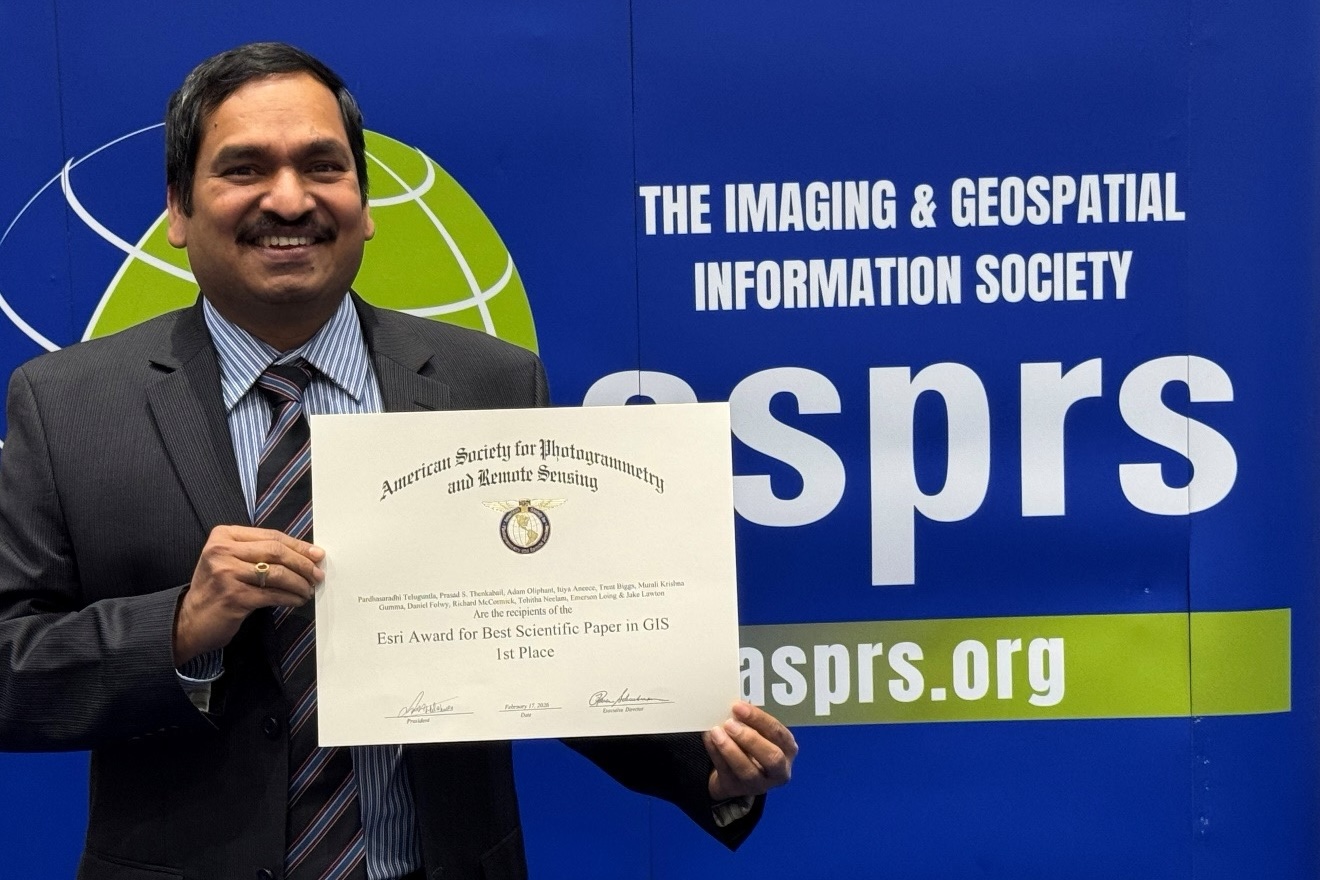
BAERI’s Pardhasaradhi Teluguntla (Pardha) (first author) and his co-authors have received the first place 2026…
Mixing Movement, Migration, and Modeling: The Internet of Animals
By Jane Berg and Tamara Enz
June 6, 2025
What is the Internet of Animals?
For thousands of years, people could only guess at the movements of animals once they were beyond where we could see and hear them directly. When scientists first attached radio transmitters to wildlife, it revolutionized what we could learn about an animal’s life. Yet early telemetry devices were cumbersome, limited to larger animals, and required researchers to follow animals in the field to track signals. The scientists currently at the frontiers of this research are working with tags that are smaller and lighter than ever, can collect more types of data, and can transmit those data via space-based technologies from anywhere on Earth.
One project these developments have enabled, called “The Internet of Animals,” is an active collaboration between the Jet Propulsion Laboratory, Yale University, NASA’s Ames Research Center, USGS Western Ecological Research Center, and the Max Planck Institute for Animal Behavior in Germany. The project’s databases already contain an enormous amount of information. One database, Movebank, is run by the Max Planck Institute of Animal Behavior and holds more than seven billion sensor records collected across 1400 globe-spanning species.
But it’s not just the plethora of telemetry data that makes this project unique. A key feature of the Internet of Animals is combining all of that wildlife telemetry with satellite remote sensing data (like surface water depth and vegetation changes collected via satellite and other technologies) to provide a more complete picture of how animals interact with their surroundings. All of these data, when paired with climate modeling, allow scientists to make predictions about where and when animals are likely to travel in the future and what other impacts that movement may lead to. For example, extreme weather events can cause movement shifts that could alter pathogen spread in unpredictable ways — as was the case in 2014, when Super Typhoon Nuri affected birds in the North American Pacific Flyway, followed by avian flu infection in the US.
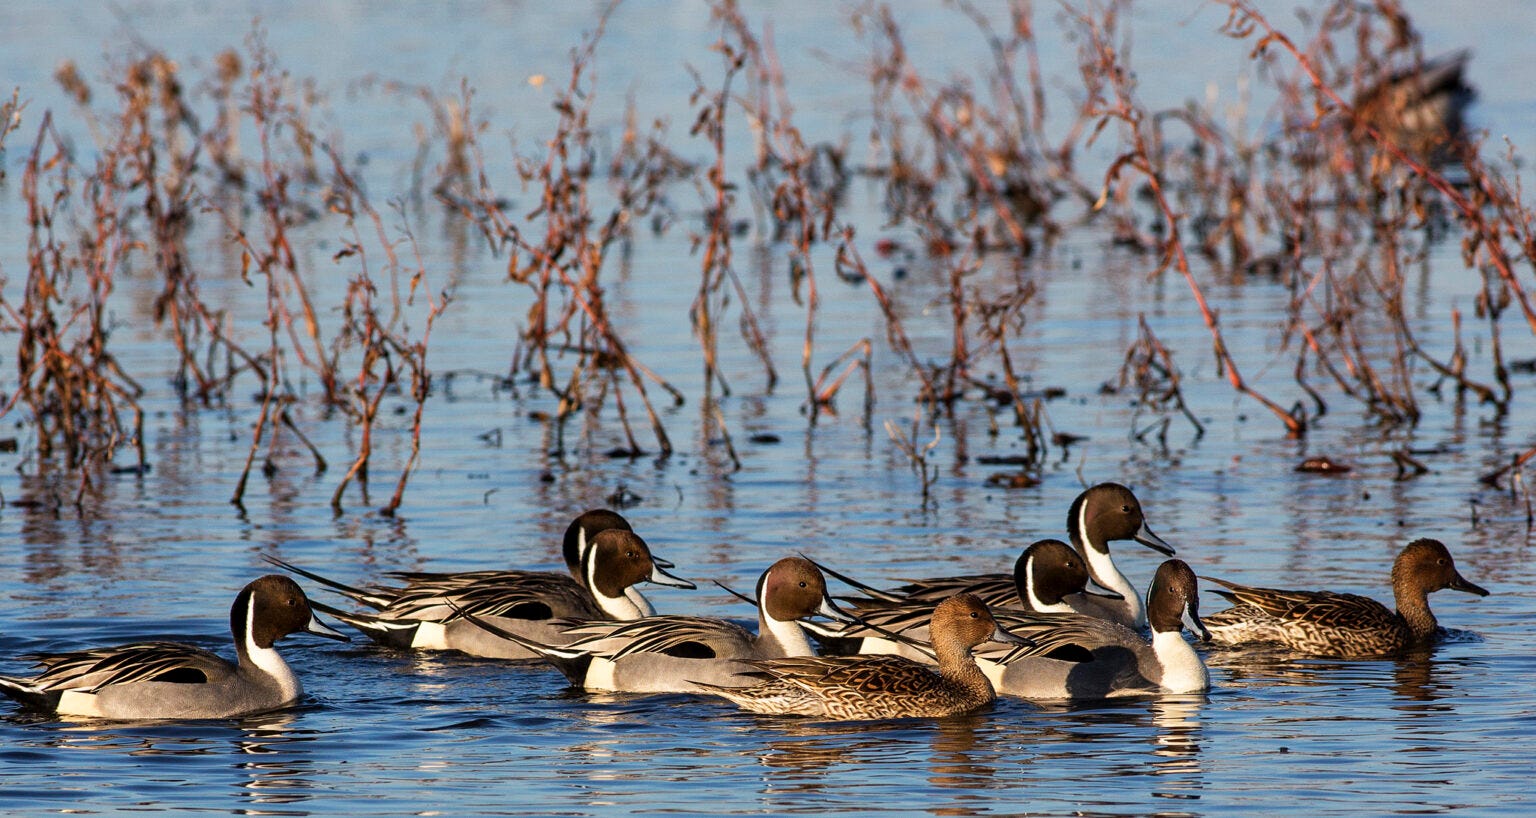
Northern Pintail in California’s Central Valley. Image: Bob Wick, Bureau of Land Management.
In addition to an animal’s location, many tracking tags now record the animal’s direction of movement, behavior, and the weather and type of habitat the animal passes through. As a result, 80% of in situ sea surface water temperature data in Antarctica come from tags on elephant seals. In addition to the surface temperature, diving elephant seals can provide a record of the water column to 1,000 meters, their regular diving depth. These data include water temperature, pressure, and salinity, and have shown that the deep, salt-dense waters driving global ocean circulation are being diluted by inflowing freshwater from melting ice sheets. It’s the kind of information that opens the door for researchers to ask a wide range of questions, including questions about an animal’s habitat use, how climate impacts migratory patterns, and whether a species’s conservation needs match protected land or water areas.
The Internet of Animals in Use
Dr. Morgan Gilmour
One of the researchers putting the Internet of Animals to use is Dr. Morgan Gilmour. A NASA Ames research scientist with a marine ecology background, she began her tracking career with radio-tagged turtles at summer camp in a Connecticut forest. “We had a big map on a table, and we handwrote … x’s of where we found the turtles,” said Gilmour. More recently, she’s been conducting research on great frigatebirds as a NASA Internet of Animals scientist. When Gilmour tagged great frigatebirds to learn about their behavior, she didn’t anticipate that they were about to map the lowest level of the atmosphere.

NASA Ames’s Dr. Morgan Gilmour. Image: nasa.gov.
Great frigatebirds have small bodies and long wings. They’re not built to flap; they’re built to soar. Gilmour’s data show that the birds are riding thermals, rising air masses of heat, rife with turbulence. The birds get a lift from the thermals through the clouds (or air) to the top of the thermal (which can take them up to 4,000 meters high), then glide back down to the sea surface. It’s an incredibly energy-efficient way for the birds to cover long distances. “They just traveled 80 kilometers, hardly without flapping,” says Gilmour.
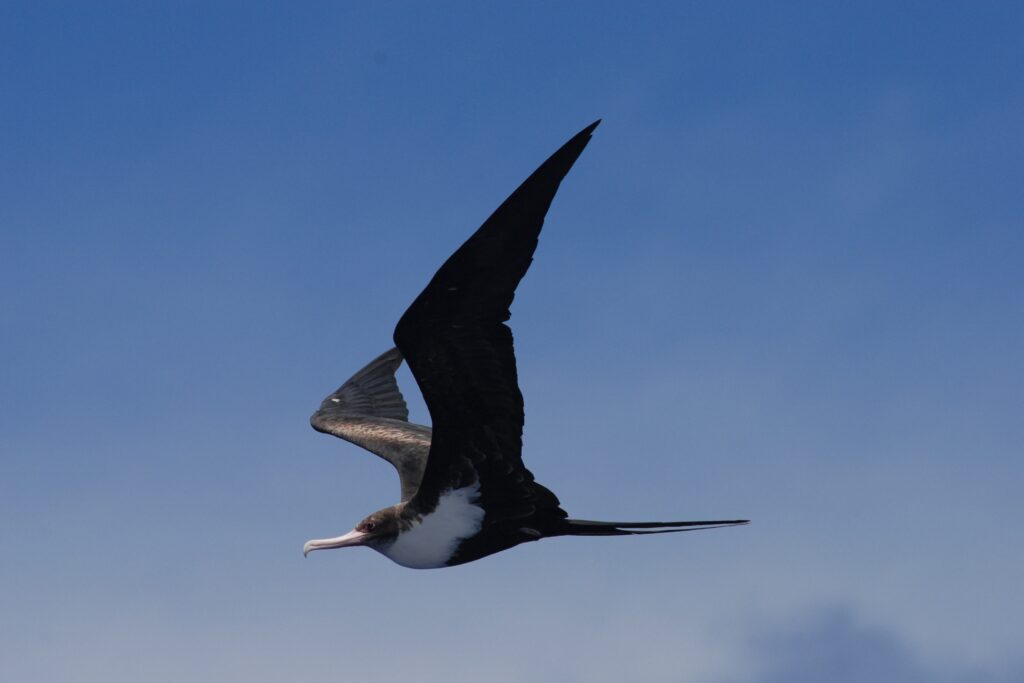
Great frigatebird. Image: NOAA/NMFS/PIFSC.
That ride the birds are taking led to an interesting discovery: they’re effectively mapping the dynamics of the planetary boundary layer (PBL). The PBL is the lowermost layer of our atmosphere. Its thickness is constantly shifting and is used to forecast weather and air pollution, among other things. Gilmour and her colleagues found that the peak altitude data from the birds’ trackers closely matched the long-term average PBL heights in the area they were flying. And, since weather balloons are not regularly deployed in the middle of the ocean, the great frigatebirds were collecting data about our atmosphere we wouldn’t otherwise have access to.
Dr. Claire Teitelbaum
While Gilmour starts her work by physically tagging and tracking animals, Dr. Claire Teitelbaum begins with the data that those animal tags provide. Mostly, Teitelbaum builds computer models to make sense of data from GPS telemetry devices carried by tagged animals. If a trove of data on an animal’s behavior exists, Teitelbaum can build a model to analyze it. Teitelbaum previously worked with BAERI and NASA Ames’s Earth eXchange (NEX) on the Internet of Animals project and the movement of avian influenza via waterfowl in North America. Motivated by conservation concerns, Teitelbaum focused her work on the ecological theory of how animals move and why.
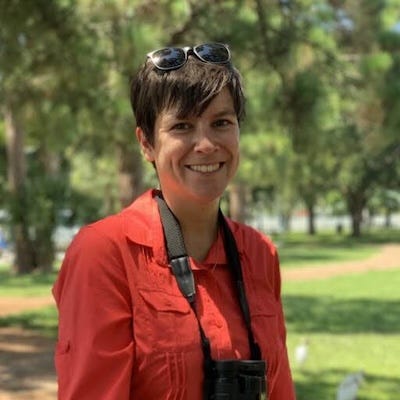
BAERI alumna Dr. Claire Teitelbaum. Image: Cali Wilson.
Alongside colleagues at the US Geological Survey, Teitelbaum studied the movements of several species of waterfowl in the Central Valley of California. This region is a popular overwintering site for migrating birds, but it’s also an area with many poultry farms. In their paper about this work, the researchers noted that this combination makes the Central Valley “emblematic of the challenges posed by environmental change for both wildlife and agriculture.” The researchers found that almost all waterfowl avoided the poultry farms. Instead, they preferred wetlands and protected areas. Increasing wetland habitats might help prevent wild birds from spending time within the farms themselves when they’re looking for suitable overwintering habitats. If drought continues to reduce wetland habitat, it could lead to birds spending more time in farm ponds and other irrigated areas. This could increase their possible contact with poultry, which would in turn increase the likelihood of avian flu spreading from wild birds to poultry farms.
The ability to work with combined telemetry and remote sensing data is a powerful tool here too. “If we think that a duck is usually shedding flu virus for a week, then we can look at whether weekly movement distances are related to, for example, how much water is on the landscape,” says Teitelbaum. “And we could extend that either spatially or temporally to say [that] these places in the US might be at higher risk of avian flu spread because they have these certain environmental characteristics.”
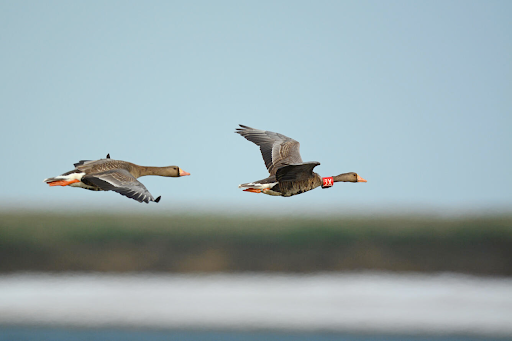
Banded greater white-fronted geese flying in northern Alaska. Image: Ryan Askren, USGS.
The Internet of Animals is doing more than just advancing wildlife research. By integrating animal tracking with satellite and environmental data, scientists can now work to answer more nuanced questions about animals and the environments they move through, offer more accurate data to support conservation efforts, and help animals and humans better prepare for the impacts of a changing planet.
Related Posts